• Skip to primary navigation
  • Skip to main content
  • Skip to primary sidebar
  • Skip to footer
Jennifer Marohasy

Jennifer Marohasy

a forum for the discussion of issues concerning the natural environment

  • Home
  • About
  • Publications
  • Speaker
  • Blog
  • Temperatures
  • Coral Reefs
  • Contact
  • Subscribe

Archives for September 2014

Open Thread

September 30, 2014 By jennifer

Sophie C. Lewis and David J. Karoly have just had a paper published by the American Meteorological Society.
crabs are real, homogenised data is not

Its starts on page 31 of a special edition, ‘Explaining Extreme Events of 2013: From a Climate Perspective’ that is a special supplement to the Bulletin of the American Meteorological Society, Volume 95, Number 9, September 2014.

In this peer-reviewed paper I see that the homogenised ACORN-SAT data is labelled “Observations”.

Stupid is as stupid does.

Filed Under: News

Sydney Morning Herald not balanced, not fair, not factual

September 28, 2014 By jennifer

ON 10th September 2014, the Sydney Morning Herald published an article suggesting that I was an amateur, hostile to climate science and in denial. When I attempted to respond by way of an opinion piece, I was told there was no space. That I would not be published. Jen rain

I’ve just lodged a complaint with the Australian Press Council. They only allow 400 words by way of ‘reason for complaint’. I’ve provided the following reasoning:

Michael Brown’s article ‘Pseudoscience and nonsense reign once science is left behind in climate debate’, published by the Sydney Morning Herald on 10th September 2014, is in breach of the Australian Press Council’s General Principles 1 and 3. In refusing to provide Jennifer Marohasy with an opportunity for reply The SMH is in breach of Principle 4.

There are four key errors of fact that combine to mislead the reader. Dr Brown claims Dr Marohasy has found “a few potential errors” in the homogenisation process as implemented by the Bureau. In fact Dr Marohasy has shown that the homogenisation process as implemented by the Australian Bureau of Meteorology is flawed because it can result in changes to both the direction and magnitude of temperature trends. Dr Brown claims Dr Marohasy has cherry-picked a few unrepresentative examples. The examples provided by Dr Marohasy are real, valid, and illustrate the potential impact of homogenisation, which is to mislead the public on climate change. Dr Brown claims that Australia continues to warm and the warming temperature trend is clear in raw and homogenised data for 100 years. In fact Australian and global average surface air temperature has remained more or less steady since 2001 (e.g. Nature Climate Change, volume 4, pages 222-227).

Dr Brown describes Jennifer Marohasy as a “plucky amateur”. Dr Marohasy is not an amateur. Indeed Dr Brown has also omitted key facts in particular that Dr Marohasy is an adjunct research fellow at Central Queensland University with several recent peer-reviewed publications in climate science.

Dr Marohasy submitted an opinion piece correcting some key errors of fact on 15th September 2014. On 16th September she was advised that it would not be published.

In publishing Dr Brown’s opinion, but refusing to publish Dr Marohasy’s rebuttal, the Sydney Morning Herald is continuing to withhold important information from the Australian public, in particular most Australians remain ignorant of the fact that all the data used to calculate national temperature trends is homogenised, that this can have an impact on both the magnitude and direction of temperature trends. Furthermore in publishing an article that suggests Dr Marohasy is “hostile” to climate science, practices “pseudoscience”, is in “denial”, and performs “sloppy” work, the Sydney Morning Herald is not only misleading its readers, but also defaming Dr Marohasy.

I would have thought that in the interests of balance, fairness and keeping their readership across the issue that the Herald could have simply published the opinion piece that I submitted. This article follows:

Evidence and transparency is important in science

If some technocrats had their way, it would be accepted practice to routinely alter historical temperature records, particularly if those records did not accord with global warming theory.

I have complained for some time about the practice of homogenisation undertaken by the Australian Bureau of Meteorology. My concerns were mostly ignored until I gave a lecture at the Sydney Institute in July. There, I described how cooling trends at RAAF Base Amberley in Queensland and the post office at Bourke in New South Wales have been changed into warming trends through homogenisation.

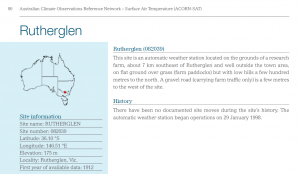
More recently, I provided The Australian with an example from an agricultural research station outside Rutherglen in north-eastern Victoria. Since 1912, a weather station there has observed an overall cooling trend. Rather than incorporate this cooling into the official record, the Bureau has applied algorithms that have flipped the cooling trend of 0.35 degrees Celsius into a warming trend of 1.73 degrees Celsius.

Homogenisation may legitimately be used in climate science to correct for anomalies in data when stations are relocated from one site to another. The Bureau claims that the Rutherglen station was moved in the 1960s or 1970s. Yet there is no evidence to suggest it was ever moved. Even if it were so, this does not explain why the record for, say, 1913 is a full 1.8 degrees Celsius cooler in the modified and homogenised data than in the original.

The overall effect of manmade global warming is estimated to be 0.8 degrees Celsius over the last century. If so, homogenisation has the potential to create a highly distorted impression of temperature trends.

That is only the start. When the entire instrumental record is considered, the very hottest years in Australia occurred in the late 1800s. Indeed the hottest year on record is perhaps 1878, and the hottest January was in 1896. This is not what we have been conditioned to believe, but it is what the data shows. The Sydney Morning Herald itself documented the heatwave of January 1896, reporting on the mass evacuation of affected residents by train from inland regions.

The Bureau believes that data prior to 1910 is unreliable for the purposes of the national record. The same Bureau, however, is happy to use that data for reporting global temperatures.

If we take those early records into account, it is clear that New South Wales experienced cooling from the late 1800s to about 1960. After 1960, temperatures across the state and the nation started to increase. This warming continued until it reached a plateau in 2002. Because the warming of the late twentieth century never completely negated the cooling of the early twentieth century, the overall net trend is actually one of cooling.

Peer-reviewed literature supports my contention that early twentieth century cooling was real and significant and that homogenisation creates an artificial warming trend in the official temperature record for Australia.

Yet last Wednesday in the opinion pages of the Sydney Morning Herald (Pseudoscience and nonsense reign once science is left behind in climate debate) Michael Brown, an astronomer from Monash University, argued that I had found merely “a few potential errors” in the data “while ignoring the fact that warming across Australia is seen in both raw and homogenised data”.

I have always been of the opinion that anyone who doesn’t take truth seriously in small matters cannot be trusted in large ones either. Insisting on precision and transparency is not, as Dr Brown suggests, quackery, pseudoscience or “plucky amateurism”. It is the very essence of scientific method.

Unfortunately, we have reached a stage where consensus is driving the science, rather than science shaping the consensus.

It is often said that global warming is the greatest moral issue of our times. If so, the truth surely matters. Upholding the truth means respecting dissent. It requires careful and public scrutiny of information which does not conform to received wisdom.

____________________________

Dr Jennifer Marohasy is an Adjunct Research Fellow at Central Queensland University with six recent peer-reviewed publications in climate science focused on the application of artificial intelligence to rainfall forecasting. This research required Dr Marohasy to compile long temperature series for different locations as arrays for a neural network model, in the process she became interested in the methodology used by the Bureau of Meteorology in the compilation of an annual average temperature for Australia.

Sources, if required, for para beginning “The peer-reviewed literature”:
Deacon, E.L. 1952, Climatic Change in Australia since 1880, Australian Journal of Physics, Volume 6, Pages 209-218, see especially Figure 1 showing the ten-year running averages of mean summer maximum temperature for Bourke, Alice Springs Narrabri and Hay)

Trewin, B. 2013, A daily homogenized temperature data set for Australia, International Journal of Climatology, Volume 33, see especially page 1524)

Source, if required for para beginning “That is only the start”:

‘Excursion to Cool Climates’, January 25, 1896 and Extraordinary Heat at Wilcannia, January 18, 1896.

Filed Under: Information, News, Opinion Tagged With: Temperatures

Absolutely Politically Incorrect: Maximum Temperatures at Bourke and Bathurst

September 24, 2014 By jennifer

The only thing that interferes with my learning is my education. Who said that? What does it mean?

Of course, for the educated climate scientist this chart that shows the mean annual maximum temperatures for Bathurst gaol and Bourke post office should be homogenised. But what beauty and intrigue in raw data that throws up an identical cooling trend when the entire record, unhomogenised is plotted for these two locations in New South Wales, both with exceptionally long records.

Bourke n Bathurst MaxT

I shall not be posting so much for the next little while, as I’ve technical papers to write on rainfall forecasting, diatoms, frogs and also temperatures.

Filed Under: Information Tagged With: Temperatures

Open Thread

September 22, 2014 By jennifer

“The mass crushes out the insight and reflection that are still possible with the individual, and this necessarily leads to doctrinaire and authoritarian tyranny if ever the constitutional State should succumb to a fit of weakness.

In a state of collective possession they are the adapted ones and consequently they feel quite at home in it.  C.G. Jung 1957, page 5
In a state of collective possession they are the adapted ones and consequently they feel quite at home in it. C.G. Jung 1957, page 5

“Rational argument can be conducted with some prospect of success only so long as the emotionality of a given situation does not exceed a certain critical degree. If the effective temperature rises above this level, the possibility of reason’s having any effect ceases and its place is take by slogans and chimerical wish-fantasies. That is to say, a sort of collective possession results which rapidly develops into a psychic epidemic.”

The Undiscovered Self by C.G. Jung. 1957. Pages 4-5.

Filed Under: Information Tagged With: Climate & Climate Change

Who’s going to be sacked for making-up global warming at Rutherglen? Part 2.

September 19, 2014 By jennifer

THE Bureau of Meteorology has spent several weeks looking for documentation to support its recent claim that, contrary to what is written in its published station catalogue, the weather station at Rutherglen was once moved. Station Catalogue

The Bureau hasn’t been able to find any actual documentation to verify this move. But this hasn’t stopped it nevertheless concluding that there was a station move and publishing a document, not in the peer-reviewed literature, but on the Internet to conclude that the weather station was once moved between paddocks.

Furthermore, but not even published on the Internet, this move between paddocks, that could have occurred in 1966 or even 1974 apparently justifies a drop down in minimum temperatures, with the largest change a 1.8 degree Celsius difference between recorded and homogenised temperatures for Rutherglen in 1913. The net effect on the temperature trend is the creation of a 1.73 degree Celsius per century warming, where previously there was a 0.35 degree C per century cooling in the minimum temperature series.

It makes no sense!

But it hasn’t stopped the alarmists on Twitter and at HotWhopper claiming the Bureau was right all along: the weather station had moved, there are maps and photographs and conclusions, just no actual documented evidence. Indeed it doesn’t seem to have occurred to Lotharsson and the rest of the HotWhopper cheer squad, that if the Bureau was able to find inspection reports, requests for replacement equipment and more, that there should also be documentation if the station had actually been moved!

Of course it may have been moved, and the documentation may have been lost, but that still doesn’t justify the change in magnitude and direction of the temperature trend for Rutherglen that the Bureau has made.

My colleague, Bill Johnston, has forensically examined the temperature data generated by the weather station at Rutherglen. Dr Johnston is of the opinion that it is possible that there was a site move in 1965. He can find a break in the data at this time. But even accounting for this, there is no overall warming trend in the data either side of this break. So, Dr Johnston has concluded after running three independent statistical tests over the data, that it is the Bureau that has changed the data, resulting in a bias in the data series where none previously existed.

HotWhopper haven’t actually examined the data, or thought about whether moving a weather station between paddocks in a relatively flat rural terrain could cause a change in the direction and magnitude of the temperature trend. They are just celebrating that the Bureau could publish on the Internet claiming a site move.

According to HotWhopper, quoting the Bureau, the need for an adjustment to the Rutherglen data was made through the application of, “an objective statistical test that showed an artificial jump in the data during this period” prior to 1966.

In fact statistical tests cannot show “artificial jumps”. What empty heads they are at HotWhopper and the Bureau!

Statistical tests can detect breakpoints in temperature series. These may be attributable to climatic or non-climatic factors.

The Bureau claims that, 1966 and 1974 dates match the two breakpoints in minimum temperatures through a “statistical comparison of its [Rutherglen] data with other site data in the region.”

So, the Bureau is suggesting the “jump” is non-climatic and due to the weather station being moved because, while there is “no firm documentation” for a site move, 12 documents have been located that together, they claim, provide some circumstantial evidence for the weather station having been moved between paddocks.

Importantly, the Bureau is not claiming any breakpoints in the Rutherglen data per se, but rather that the trend at Rutherglen is not consistent with its neighbours at about the times for which there is circumstantial evidence the station was moved from one paddock to another.

It is in fact disingenuous and illogical for the Bureau to suggest that what could only be considered an insignificant move, if indeed it did occur, that is a move between paddocks in a relatively flat rural terrain could create a change in the direction and magnitude of the temperature trend.

But there is more. While the BOM claim a discontinuity based on neighbouring stations the algorithms and/or test that might show such a result are not disclosed. We are expected to believe this is the case, but this is not science because no methodology has been provided. In fact, when one of my colleagues, Ken Stewart, tested this proposition. He found that the raw data for Rutherglen has a virtually identical trend to its neighbouring comparison sites, while the homogenised ACORN-SAT data for Rutherglen is strongly biased towards warming relative to those neighbouring sites.

So, I ask again, who is going to be sacked for making up global warming at Rutherglen?

Filed Under: Humour, Information, News Tagged With: Temperatures

Homogenisation of Williamtown temperatures, draws attention to hot Newcastle in 1878

September 15, 2014 By jennifer

WINSTON Churchill famously said that, democracy is the worst form of government except for all the others. Indeed when everyone has the opportunity to have a say it can be difficult to keep everyone marching together in the same direction, at the same speed, repeating the same mantra.

Of course, getting to the truth often requires alternative opinions to be heard, and perhaps now, finally, the mainstream media will start to allow those sceptical of the theory of anthropogenic global warming to have their say. Indeed just today the Newcastle Herald published the opinion of Anthony Cox explaining how the Australian Bureau of Meteorology homogenise the data. It’s a good article, but was not published in full, and published without a key chart showing the affect of homogenisation on the temperature trend.

Williamtown

What the chart actually shows is that for the Williamtown RAAF, near Newcastle, the minimum temperature series that begins in 1951 has been homogenised. That is, in the creation of the official temperature series temperatures have been changed from what was originally recorded. Like for Rutherglen in Victoria, and Amberley in Queensland, the temperatures are dropped down starting in about 1971. This has an affect on the overall trend, changing what was a mild warming of 0.4 degree C per century from 1951 to 2012, into dramatic warming of 1.6 degree C per century.

Ignoring this new example of homogenisation at Williamtown RAAF, and the 28-pages of ‘adjustments’ released by the Bureau just last week that show most, if not all the weather stations that make-up the official station network are corrupted, the first person to comment at the thread that is now open at the Newcastle Herald is suggesting that I am “cherry picking” and that the overall trend for Australia is surely one of warming.

In fact I’ve hardly started with my criticisms, and the overall trend for Newcastle, like the rest of Australia, is very much one of cooling.

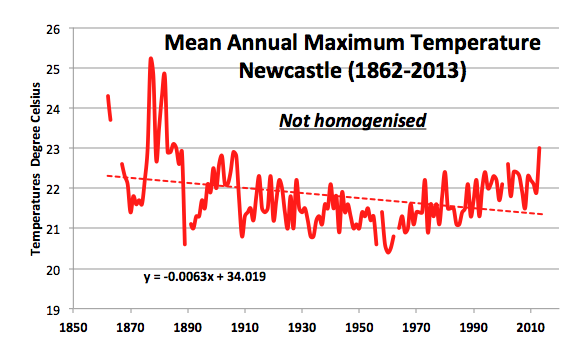
Let me explain, Williamston RAAF is one of the 112 stations that is used to calculate national trends, but it’s not the best temperature series for the Newcastle region. It only starts in about 1951. A much more comprehensive record, but one that is conveniently ignored by the Bureau in the development of the official temperature network, comes from the Nobby’s Signal Station, Newcastle. This record starts way back in 1862, and guess what, like most of the really long records it shows that it was much warmer in the late 1800s than for any time since. In fact the hottest years on record are 1877 and 1878.

We have been conditioned to believe that temperature have been gradually warming, but this is not what the data shows.

Newcastle

When those early records are taken into account, it is clear that New South Wales experienced cooling from the late 1800s to about 1960. After 1960, temperatures across the state and the nation started to increase. This warming continued until it reached a plateau in 2002. Because the warming of the late twentieth century never completely negated the cooling of the early twentieth century, the overall net trend is actually one of cooling. In the case of Newcastle, its a cooling of 0.63 degree Celsius per century.

****
Also today, Graham Young has republished an earlier blog post by me, ‘Bureau caught in own tangled web of homgenisation’ at On Line Opinion…
http://www.onlineopinion.com.au/view.asp?article=16680

Any comments you can make in this comment thread would be appreciated.

And perhaps also at the Newcastle Herald thread here… http://www.theherald.com.au/story/2558481/opinion-adjusted-temperatures-need-explaining/?cs=308

After all, in a democracy your vote, your opinion, does count even if it does not accord with popular opinion.

If you want to Tweet this, I’ve made a new tiny URL.. http://tinyurl.com/nbm54ts

Filed Under: Information, News, Opinion Tagged With: Temperatures

  • Go to page 1
  • Go to page 2
  • Go to page 3
  • Go to Next Page »

Primary Sidebar

Recent Comments

  • Ian Thomson on Vax-ed as Sick as Unvax-ed, Amongst My Friends
  • Dave Ross on Vax-ed as Sick as Unvax-ed, Amongst My Friends
  • Dave Ross on Vax-ed as Sick as Unvax-ed, Amongst My Friends
  • Alex on Incarceration Nation: Frightened of Ivermectin, and Dihydrogen monoxide
  • Wilhelm Grimm III on Incarceration Nation: Frightened of Ivermectin, and Dihydrogen monoxide

Subscribe For News Updates

  • This field is for validation purposes and should be left unchanged.

September 2014
M T W T F S S
1234567
891011121314
15161718192021
22232425262728
2930  
« Aug   Oct »

Archives

Footer

About Me

Jennifer Marohasy Jennifer Marohasy BSc PhD has worked in industry and government. She is currently researching a novel technique for long-range weather forecasting funded by the B. Macfie Family Foundation. Read more

Subscribe For News Updates

Subscribe Me

Contact Me

To get in touch with Jennifer call 0418873222 or international call +61418873222.

Email: jennifermarohasy at gmail.com

Connect With Me

  • Facebook
  • LinkedIn
  • RSS
  • Twitter
  • YouTube

Copyright © 2014 - 2018 Jennifer Marohasy. All rights reserved. | Legal

Website by 46digital