IF you believe Australia’s Climate Commissioner, Tim Flannery, it is getting hotter and hotter in Western Sydney.[1]
But scientist Basil Beamish noticed that in the Climate Commission report they only show the trend of the number of hot days from 1970-2011. There is data for Sydney, measured at Observatory Hill, back to 1890.
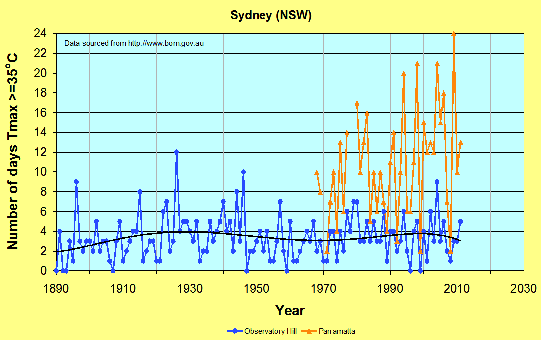
Dr Beamish noticed that if you use all of the hot days data back to 1890 it is clear there is a different long-term pattern in play (see blue line in chart). In fact the year with the greatest number of hot days for Sydney is 1926 (12 days) and this has not been beaten since.
But instead of reporting on the long term trend for Sydney as measured at Observatory Hill from 1890, Professor Flannery has chosen to just focus on Western Sydney and in particular use only the data for Parramatta North (see red line in chart). This data set begins in 1970, which was a low point in the hot days cycle. By choosing Parramatta and beginning in 1970, Professor Flannery can make the upward trend in hot days look dramatic.
Parramatta is further inland than the Observatory Hill site and so the summers are warmer and the winter’s colder. But if there were data for Parramatta back to 1890 it would almost certainly show the same pattern as Observatory Hill. Indeed it was almost certainly hotter in Parramatta, in Western Sydney, in 1926 than anytime since.
Once again the observational data does not support the nonsense claims made by Australia’s Climate Commissioner, Professor Flannery.
******
Basil Beamish provided the chart and many of the words. Thank you.
1. http://www.abc.net.au/news/2012-05-14/heatwaves-bushfires-predicted-to-hammer-nsw/4009006


 Jennifer Marohasy BSc PhD has worked in industry and government. She is currently researching a novel technique for long-range weather forecasting funded by the B. Macfie Family Foundation.